The Noise & The Node.
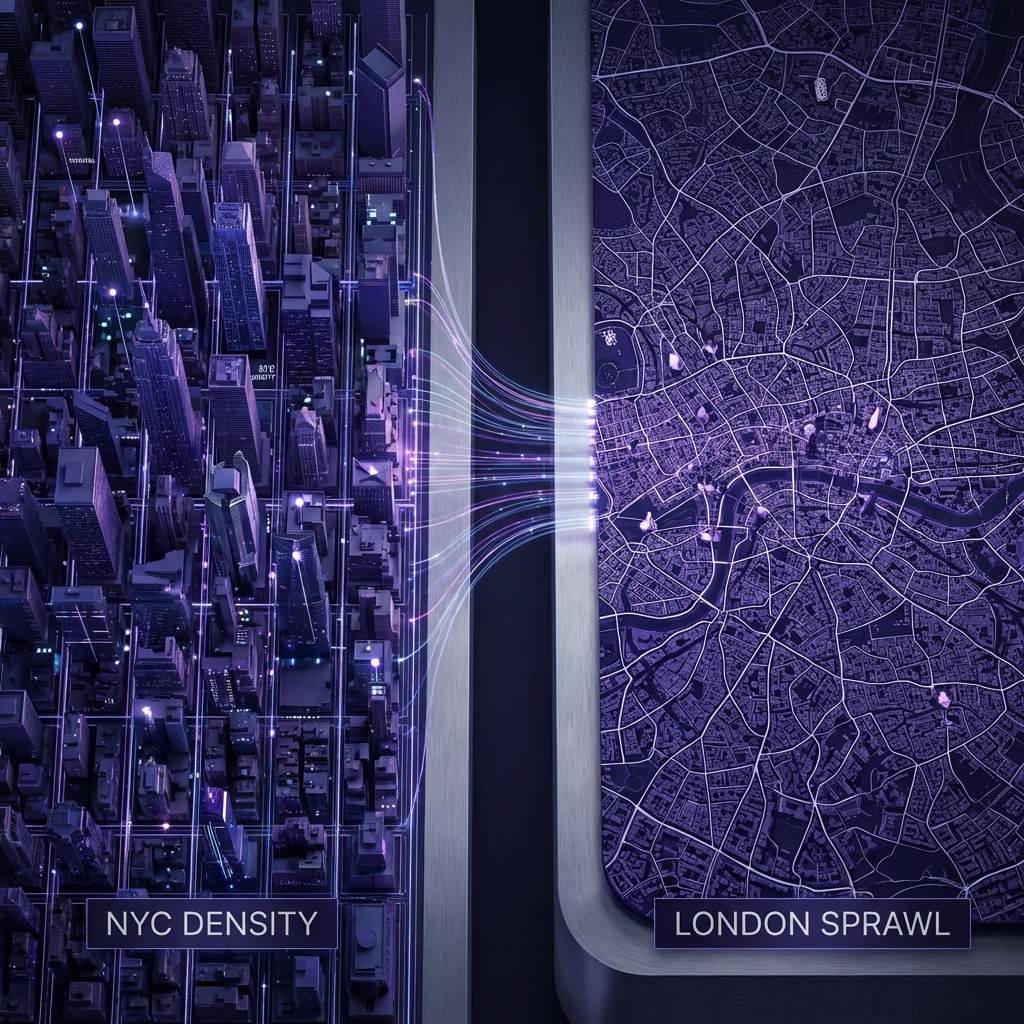
Two cities. Two distinct signatures of chaos. We analyzed millions of data points to map the friction of New York against the fracture of London.
Safety is not a single number. It is a texture. When you walk through a city, you feel it—the hum, the density, the sudden stops. At Tranzia, we collect hyper-local safety data to guide travelers, but sometimes the data speaks back to us, revealing patterns that are less about "crime" and more about the fundamental personality of the metropolis.
In our latest analysis of New York City and London, we found two radically different risk profiles. One is a constant, low-level buzz of friction. The other is a smooth-running machine that suffers from catastrophic, punctuated failures.
NYC: The Constant Hum
New York City doesn't inherently break; it vibrates. Our sensors picked up an overwhelming dominance of Noise Complaints (82%) across the grid. It is the city that never sleeps because it is physically unable to be quiet.
The safety risk in NYC is diffuse. It's everywhere, all the time, but usually low-severity. It’s a texture of grit—broken infrastructure, loud parties, construction. It’s stressful, but predictable.
NYC Soundscape
Real-time Noise Complaints (Simulated)
London Arteries
Transit Network Status
London: The Sudden Break
London is different. For miles, the risk score is near zero (0.16/10 avg). It feels safe, orderly, quiet. Until it isn't.
The data shows that London's primary failure mode is Infrastructure & Transit (86%). Unlike NYC's constant hum, London suffers from "cardiac arrests"—severe, critical signal failures or traffic gridlocks that paralyze entire sectors. The risk isn't background radiation; it's a lightning strike.
The Risk Signature
When we compare the two on a radar, the shapes are inverted. NYC is broad and shallow. London is narrow and deep.
Risk Composition
What does this mean for you?
If you are in NYC, carry noise-canceling headphones and watch your step. The friction is constant. If you are in London, check the status updates. The city is peaceful, right up until the moment it stops moving.
Explore the Live Map